Creating a codeless data connector for Microsoft Sentinel
In this post we'll explore the process of using the new Codeless Connector Platform (Preview) to ingest Atlassian Jira audit logs into Microsoft Sentinel...
Warning: this post has not been updated since 2022, and is likely outdated. Please refer to Microsoft’s documentation for more up-to-date information.
Introduction
Microsoft recently introduced the Codeless Connector Platform - a new preview feature for Microsoft Sentinel that enables partners, developers and power users with the ability to create custom connectors to ingest data from third-party REST APIs without writing a single line of code. Key features of the platform include:
- Fully serverless, SaaS implementation eliminates the need for additional services (e.g. Azure Logic Apps, Azure Functions, etc)
- Customisable user interface components
- Extensible configuration options for different REST API types and capabilities
- Backed by Microsoft Sentinel support SLAs
- Built-in support for Microsoft Sentinel health monitoring
In this post we’ll explore the process of using the platform to ingest Atlassian Jira audit logs into Microsoft Sentinel.
Reviewing the prerequisites
The process of creating a codeless data connector for Microsoft Sentinel can be summarised as follows:
- Configure the connector’s user interface
- Configure the connector’s polling settings
- Deploy the connector to your Microsoft Sentinel workspace
- Connect Microsoft Sentinel to your data source and start ingesting data
However, in order to actually create our data connector we first need a thorough understanding of how the source REST API behaves, including authentication, request/response formatting, pagination, query parameters, rate limiting, and more. We’ll touch on some of these concepts in more detail when we configure our connector’s polling settings, but for now here’s a quick summary of the methods supported by the platform at the time of writing:
- Authentication - Basic authentication, API key, OAuth 2.0 (currently in development)
- Pagination - None, link header, next page token, next page URL, offset
Here’s a great article that explains these authentication methods in more detail. With that covered, let’s take a look at the Atlassian Jira REST API documentation to figure out how our data connector will interact with the API.
Per the Atlassian documentation, the Jira REST API supports three different authentication/authorization methods; Connect apps, OAuth 2.0 and basic authentication. We’ll use basic authentication in our case (whereby a Base64-encoded string containing the client’s username and password is included in the HTTP request header) since it’s the simplest to implement.
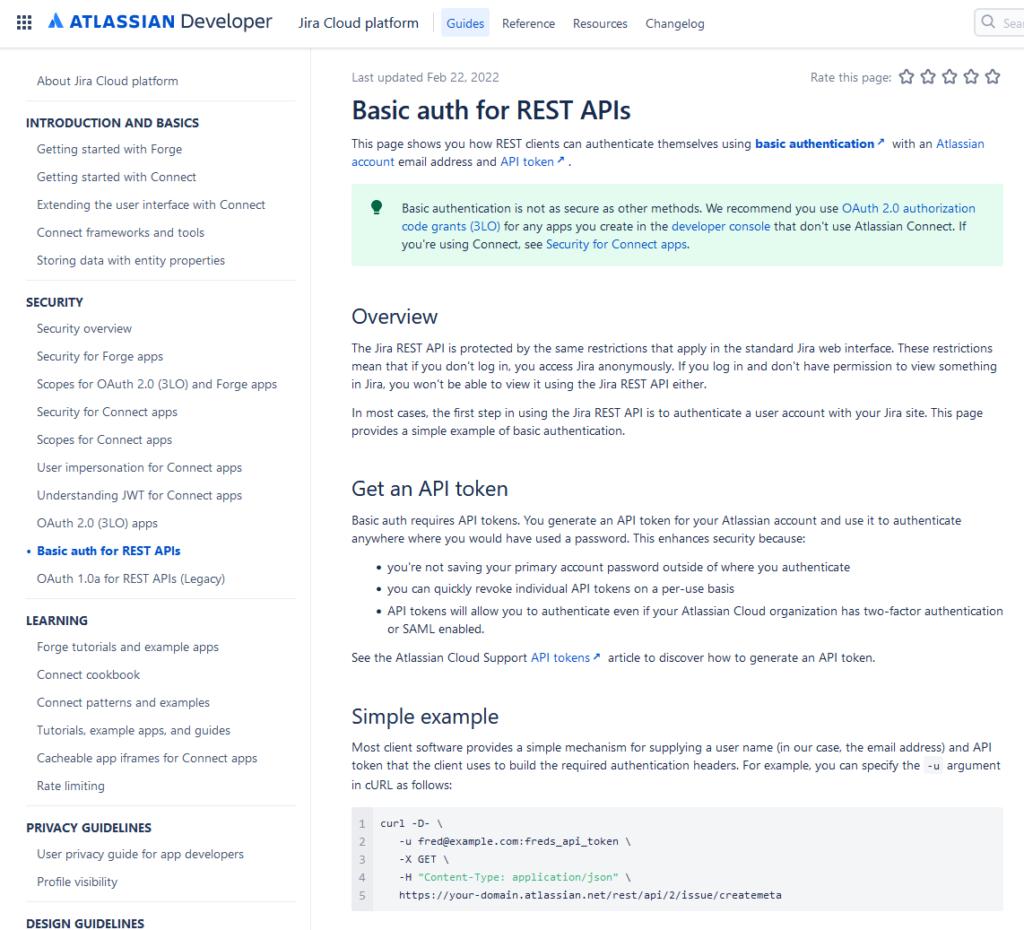
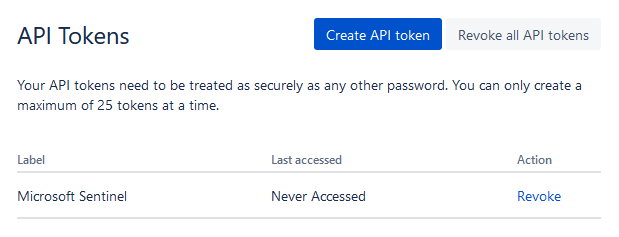
Hopping over to the basic auth for REST APIs page in the documentation, we’re provided with details on how Atlassian’s implementation of basic authentication works and instructions on how to create an API token. Follow these instructions to create an API token for yourself while we’re here:
Information
Querying audit records via the Jira REST API requires the ‘Administer Jira’ global permission. Make sure the user for which you create the API token has this permission on your Atlassian account.
Lastly, reviewing the documentation for the audit records endpoint reveals the pagination type used by the API (offset), the page limit (1000) and the query parameters used to filter the time window in which the audit records were created (from/to). Make a note of these properties since we’ll need them to configure our connector’s polling settings later.
With our API token created and a proper understanding of how the Jira REST API works, we’re ready to begin creating our codeless data connector.
Creating the deployment template
Codeless connectors are essentially a special type of Microsoft Sentinel data connector with some additional configuration options, and as such they can be deployed just like any other Azure resource - via an ARM/Bicep template, through the API or as a Microsoft Sentinel solution. In this post we’ll focus on deploying the connector using a Bicep template since it’s easy to read and makes developing the connector a much simpler task.
Here’s an overview of the deployment template:
1
2
3
4
5
6
7
8
9
10
11
12
13
14
15
16
17
18
19
20
21
22
@description('Name of the Log Analytics workspace used by Microsoft Sentinel.')
param logAnalyticsWorkspaceName string

// Reference the existing Log Analytics workspace
resource workspace 'Microsoft.OperationalInsights/workspaces@2021-06-01' existing = {
    name: logAnalyticsWorkspaceName
}

// Deploy the codeless data connector to the Log Analytics workspace
resource codelessConnector 'Microsoft.SecurityInsights/dataConnectors@2021-09-01-preview' = {
    scope: workspace
    name: guid(resourceGroup().id, 'Atlassian Jira Audit Records')
    kind: 'APIPolling'
    properties: {
        connectorUiConfig: {
          {...}
        }
        pollingConfig: {
          {...}
        }
    }
}
Data connector resources are scoped to a specific Log Analytics workspace, so in order to deploy the connector we first need to reference an existing workspace upon which Microsoft Sentinel has been installed.
Next, we declare the data connector resource at the workspace scope, give it a randomly-generated GUID for a name and specify it as being of the APIPolling kind. This is used to distinguish it from the other types used by Microsoft Sentinel for its built-in connectors, such as the Azure Active Directory and Microsoft 365 Defender connectors. You can view a full list of these connector types at the documentation for the Microsoft.SecurityInsights dataConnectors resource provider.
Lastly, we define the properties of the data connector resource, including:
**connectorUIConfig**- Defines the visual elements and text displayed on the data connector page in Microsoft Sentinel.**pollingConfig**- Defines how Microsoft Sentinel collects data from your data source.
We’ll fill in both of these objects in the following two sections.
Configuring the user interface
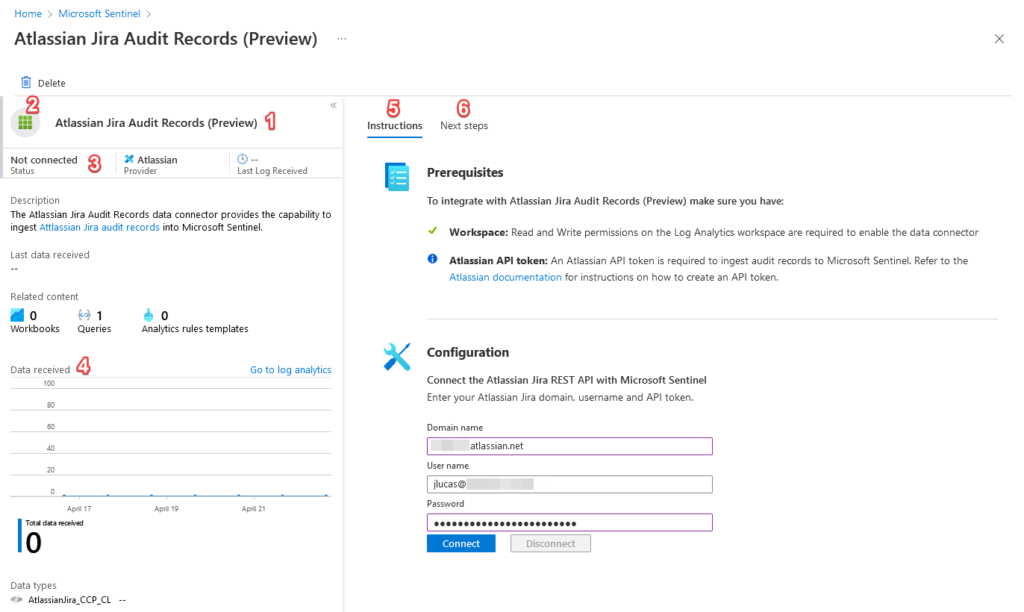
As you would expect, the connectorUiConfig object defines the layout and contents of the data connector’s user interface as it appears in Microsoft Sentinel. Shown below is an example data connector with annotations to indicate the key configurable components:
- Title - Title displayed for the data connector.
- Icon - Icon displayed for the data connector.
- Status - Indicated whether or not the data connector is currently connected to Microsoft Sentinel.
- Graph - Charts the total data ingested by the connector over the last two weeks.
- Instructions tab - List of prerequisites (e.g. workspace permissions or custom requirements) and configuration instructions to guide the user in enabling the connector.
- Next steps tab - Sample queries, workbooks and analytics rules to guide the user in working with the data ingested by the data connector.
Here’s what the connectorUiConfig object looks like for our data connector:
1
2
3
4
5
6
7
8
9
10
11
12
13
14
15
16
17
18
19
20
21
22
23
24
25
26
27
28
29
30
31
32
33
34
35
36
37
38
39
40
41
42
43
44
45
46
47
48
49
50
51
52
53
54
55
56
57
58
59
60
61
62
63
64
65
66
67
68
69
70
71
72
73
74
75
76
77
connectorUiConfig: {
    title: 'Atlassian Jira Audit Records'
    publisher: 'Atlassian'
    descriptionMarkdown: 'The Atlassian Jira Audit Records data connector provides the capability to ingest [Attlassian Jira audit records](https://developer.atlassian.com/cloud/jira/platform/rest/v3/api-group-audit-records/) into Microsoft Sentinel.'
    availability: {
        isPreview: true
        status: '1'
    }
    graphQueriesTableName: 'AtlassianJira_CCP_CL'
    graphQueries: [
        {
            baseQuery: ''
            legend: 'Atlassian Jira Audit records'
            metricName: 'Total data recieved'
        }
    ]
    dataTypes: [
        {
            lastDataReceivedQuery: '\n| summarize Time = max(TimeGenerated)\n| where isnotempty(Time)'
            name: ''
        }
    ]
    connectivityCriteria: [
        {
            type: 'SentinelKindsV2'
        }
    ]
    permissions: {
        resourceProvider: [
            {
                permissionsDisplayText: 'Read and Write permissions on the Log Analytics workspace are required to enable the data connector'
                provider: 'Microsoft.OperationalInsights/workspaces'
                providerDisplayName: 'Workspace'
                requiredPermissions: {
                    delete: true
                    read: true
                    write: true
                }
                scope: 'Workspace'
            }
        ]
        customs: [
            {
                description: 'An Atlassian API token is required to ingest audit records to Microsoft Sentinel. Refer to the [Atlassian documentation](https://support.atlassian.com/atlassian-account/docs/manage-api-tokens-for-your-atlassian-account/) for instructions on how to create an API token.'
                name: 'Atlassian API token'
            }
        ]
    }
    instructionSteps: [
        {
            title: 'Connect the Atlassian Jira REST API with Microsoft Sentinel'
            description: 'Enter your Atlassian Jira domain, username and API token.'
            instructions: [
                {
                    parameters: {
                        enable: true
                        userRequestPlaceHoldersInput: [
                            {
                                displayText: 'Domain name'
                                requestObjectKey: 'apiEndpoint'
                                placeHolderName: ''
                                placeHolderValue: ''
                            }
                        ]
                    }
                    type: 'BasicAuth'
                }
            ]
        }
    ]
    sampleQueries: [
        {
            description: 'List all Atlassian Jira audit records'
            query: '\n| sort by TimeGenerated desc'
        }
    ]
}
Let’s drill in to the properties of this object in more detail. I won’t cover every single configurable option here, so I recommend following along with the Microsoft documentation to provide some additional context as you go.
- Starting from the top, we define the
**title**,**publisher**,descriptionMarkdownandavailabilityproperties that describe the data connector - all pretty self-explanatory. - Next we define
graphQueriesand**graphQueriesTableName**, which correspond to the ‘data received’ graph that charts the total audit records ingested by the connector over the past two weeks.graphQueriesTableNameis also used as a placeholder value so that it can be referenced elsewhere in the file (as denoted by the double curly brackets in the**baseQuery**). - The
dataTypesproperty defines the Log Analytics table to which our connector will ingest the data along with a query to determine when the last log was received, and theconnectivityCriteriaproperty always has a value of ‘SentinelKindsV2’. - The
permissionsobject contains theresourceProviderandcustomssub-objects, which are used to define the permissions required to enable the connector at the Azure Resource Manager level (e.g. read/write permissions on the target Log Analytics workspace) and any other custom prerequisites. - The
instructionStepsobject contains a list of configuration steps required to enable the connector. Our data connector only has a single instruction step of type ‘BasicAuth’ which is used to indicate the authentication method our connector will implement and automatically propagate the username and password fields. Additionally, theuserRequestPlaceHoldersInputobject is used to create a placeholder parameter for the Atlassian domain name, which allows the value to be referenced in thepollingConfigin the following section. - Lastly we define the
sampleQueriesobject, which is simply a list of KQL queries that will be presented to the user on the ‘next steps’ tab to illustrate how to use the data connector.
Since our data connector is relatively simple, I’ve only implemented a subset of the customisation options available to us in this configuration. Other features include the ability to add copyable labels to expose information such as the Log Analytics workspace ID and shared keys, banner messages to highlight information and expandable instruction steps to more elegantly organise the user interface. As before, I highly recommend reviewing the Microsoft documentation and some example connectors in the Microsoft Sentinel GitHub repository to get a better understanding of how to use these options in practice.
Let’s move on to configuring our connector’s polling settings.
Configuring the polling settings
The pollingConfig object defines how Microsoft Sentinel will interact with the target REST API to ingest custom data, and contains four key properties: auth, request, paging and response. Once again, I highly recommend following along with the Microsoft documentation for additional context.
Here’s what the pollingConfig object looks like for our data connector:
1
2
3
4
5
6
7
8
9
10
11
12
13
14
15
16
17
18
19
20
21
22
23
24
25
26
27
pollingConfig: {
    auth: {
        authType: 'Basic'
    }
    request: {
        apiEndpoint: 'https:///rest/api/3/auditing/record'
        headers: {
            'accept': 'application/json'
        }
        httpMethod: 'Get'
        startTimeAttributeName: 'from'
        endTimeAttributeName: 'to'
        queryTimeFormat: 'yyyy-MM-ddTHH:mm:ssZ'
        queryWindowInMin: 5
    }
    paging: {
        pagingType: 'Offset'
        offsetParaName: 'offset'
        pageSizeParaName: 'limit'
        pageSize: 1000
    }
    response: {
        eventsJsonPaths: [
            '$..records'
        ]
    }
}
- Starting from the top, the
authproperty is used to indicate the authentication method that should be implemented by the connector. This is relatively simple for basic authentication, but can be more involved when using other methods such as API key authentication where you may need to customise settings like the API key identifier and whether the key itself is defined in the HTTP header or in a POST request payload. - Next, the
requestproperty describes the request payload for polling the REST API, such as the API endpoint, HTTP method and headers. We also define the attribute names and time format used to limit the results to a specific query window, as determined from the Atlassian Jira audit records endpoint documentation. - The
pagingproperty is used to indicate the pagination type. Since the audit records endpoint uses offset pagination, we define both the offset and page size parameter names from the REST API endpoint (i.e. ‘offset’ and ‘limit’ respectively) as well as the maximum number of records that will be returned by the endpoint in a single page. - Lastly, the
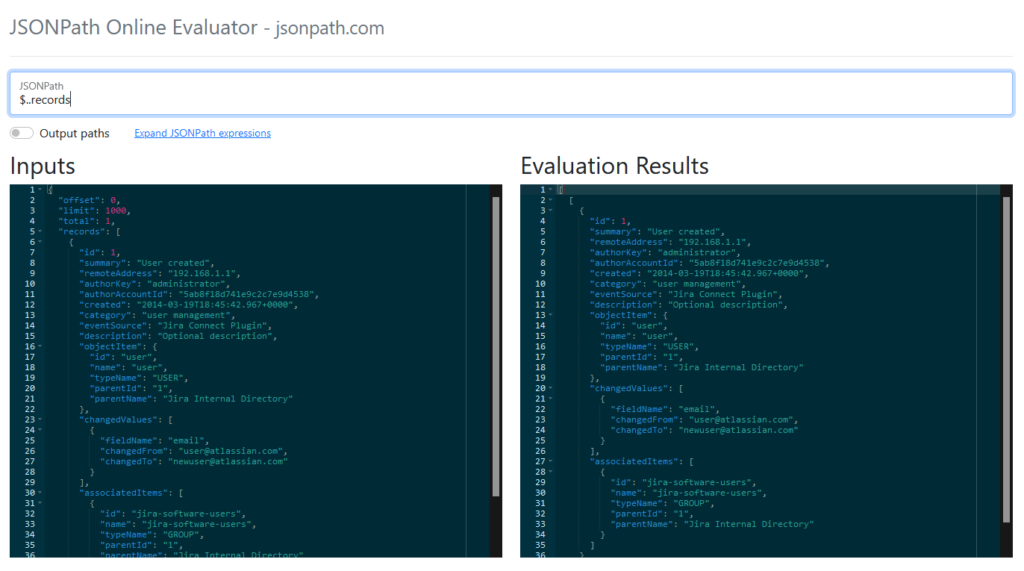
responseproperty contains a JSON path expression that Microsoft Sentinel will use to extract only the relevant data from the REST API’s HTTP response. You can use jsonpath.com to assist with creating a JSON path expression based on some sample data. Here’s an example using the$..recordsexpression to extract therecordschild object in a response from the Atlassian Jira audit records endpoint:
Once the data connector has been deployed and connected, Microsoft Sentinel will take our configuration and create a service in the back-end that continuously polls the Atlassian Jira REST API for a list of audit records within a given time window, parses the response and sends the data off to a custom table in our Log Analytics workspace. Here’s a cURL representation of an API call the poller service might make to query a list of audit records for example.atlassian.net between 9:30-9:35 AM on 2022-04-25, using an API token for user@example.com:
1
2
3
4
5
6
7
8
curl --get \
  --url 'https://example.atlassian.net/rest/api/3/auditing/record' \
  --user 'user@example.com:<api_token>' \
  --header 'Accept: application/json' \
  --data 'offset=0' \
  --data 'limit=1000' \
  --data 'from=2022-04-25T09:30:00-10:00' \
  --data 'to=2022-04-25T09:35:00-10:00'
That’s really all there is to it. As you can see, using the Codeless Connector Platform is much simpler than having to develop custom Logic Apps or Azure Functions for each unique REST API you wish to integrate with Microsoft Sentinel, provided you have a thorough understanding of the API in question.
Deploying the connector
With our Bicep template complete, save the file as main.bicep and deploy it to your Azure subscription using the Azure CLI, providing your resource group and Log Analytics workspace name where appropriate:
1
2
3
4
az deployment group create `
--resource-group <resource-group-name>  `
--template-file main.bicep `
--parameters logAnalyticsWorkspaceName=<workspace-name>
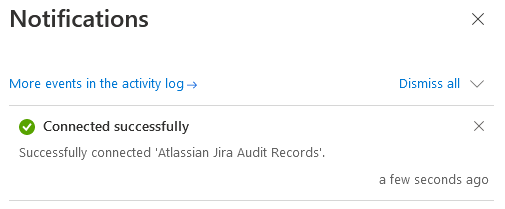
Next, head over to the Microsoft Sentinel data connectors page, search for ‘Atlassian Jira Audit Records (Preview)’ and enable the connector by submitting your Atlassian domain name (e.g. mydomain.atlassian.net), username, and API token. If everything worked, you should see a notification stating the connector was enabled successfully:
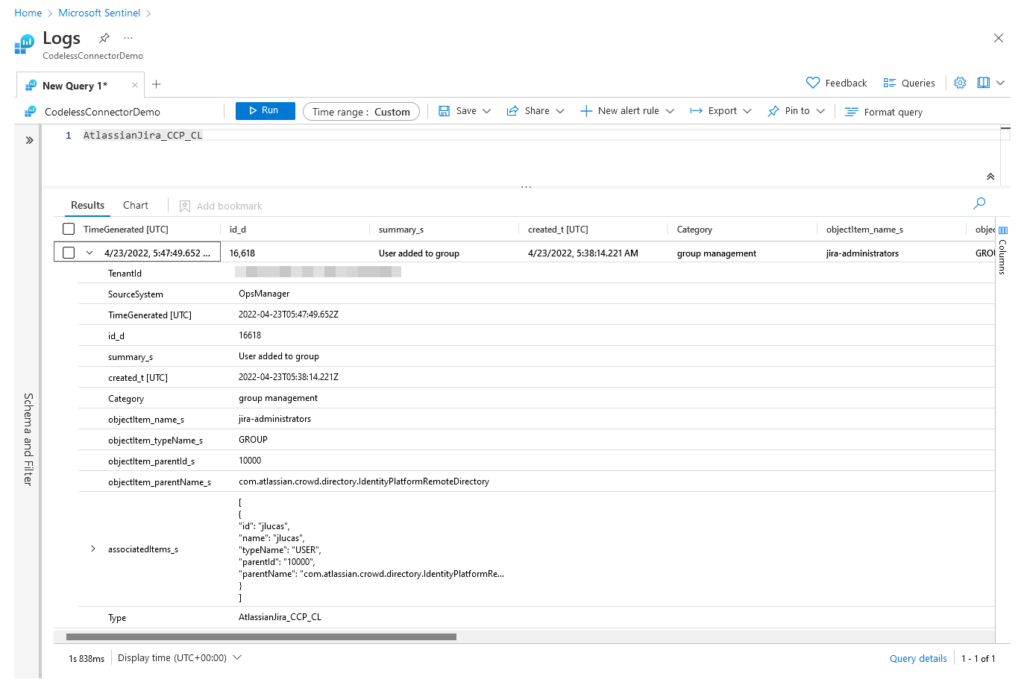
Give it a few minutes and you should start to see data being ingested into the AtlassianJira_CCP_CL table in Microsoft Sentinel. You may need to generate some activity in your Atlassian account - refer to the Atlassian documentation for a full list of audit activities in Jira applications. Here’s an example of the audit log generated by adding myself to the ‘jira-administrators’ group:
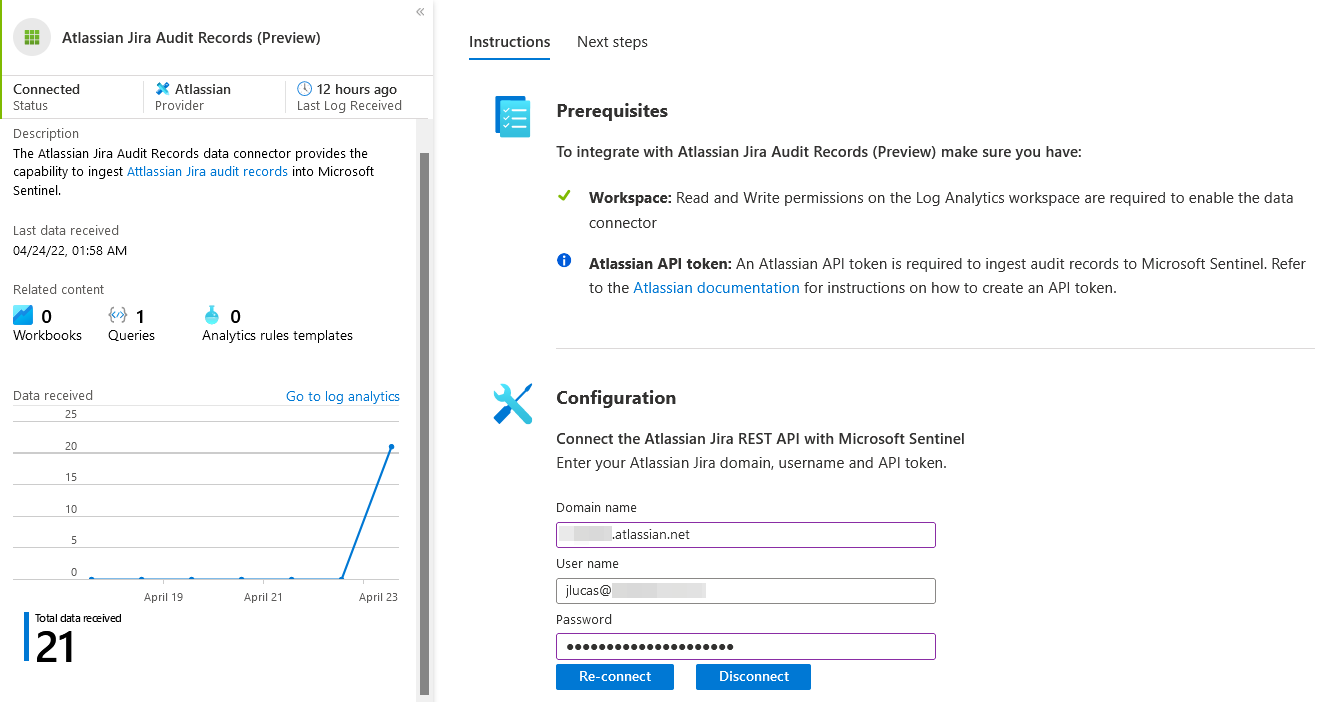
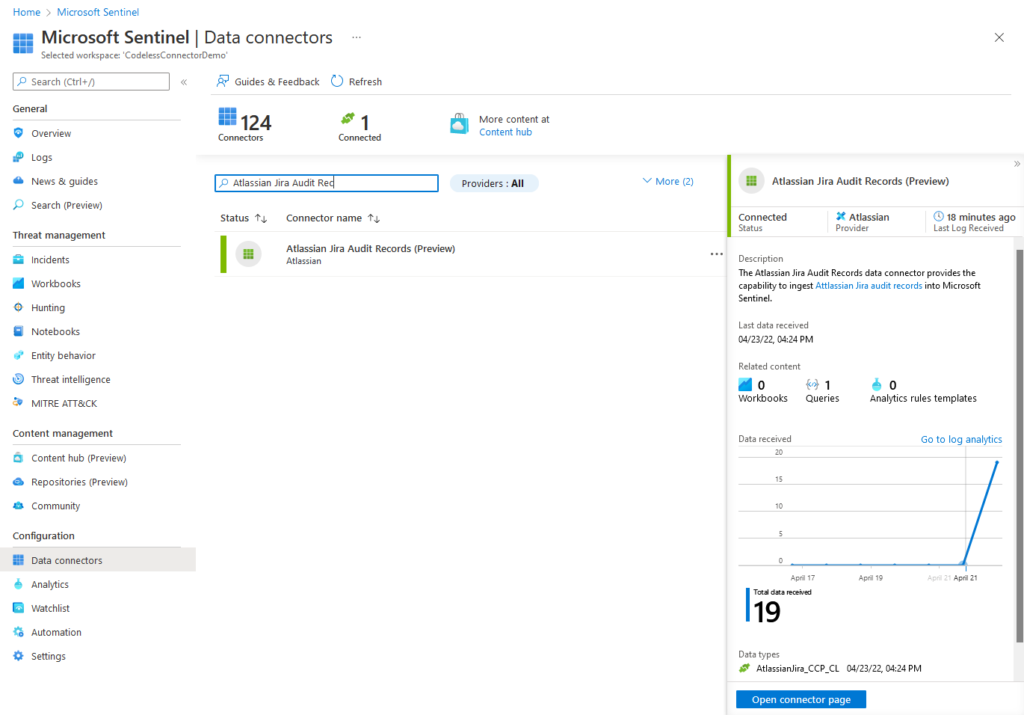
Heading back over to the data connectors page, you should now see the connector has been updated to reflect its connectivity status, when the last log was received, and a graph of the total audit records ingested by the connector over the past two weeks:
Monitoring connector health
Codeless data connectors include built-in support for health monitoring in Microsoft Sentinel, which allows you to monitor connector health, alert on data source issues (e.g. authentication errors, rate limiting, etc) and configure automated responses. It includes:
- Data connectors health monitoring workbook - Provides additional monitors, detects anomalies, and gives insight regarding the workspace’s data ingestion status. You can use the workbook’s logic to monitor the general health of the ingested data, and to build custom views and rule-based alerts.
SentinelHealthdata table (Preview) - Provides insights on health drifts, such as latest failure events per connector, or connectors with changes from success to failure states, which you can use to create alerts and other automated actions.
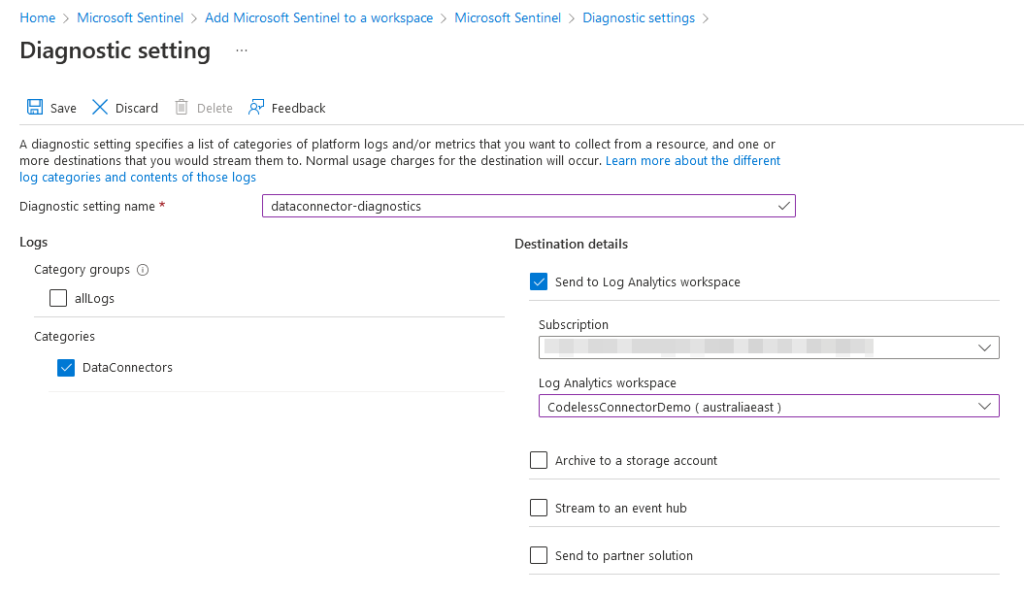
In order to enable health monitoring for your workspace, navigate to the Microsoft Sentinel diagnostic settings page and enable sending ‘DataConnectors’ logs to the underlying Log Analytics workspace as per the image below:
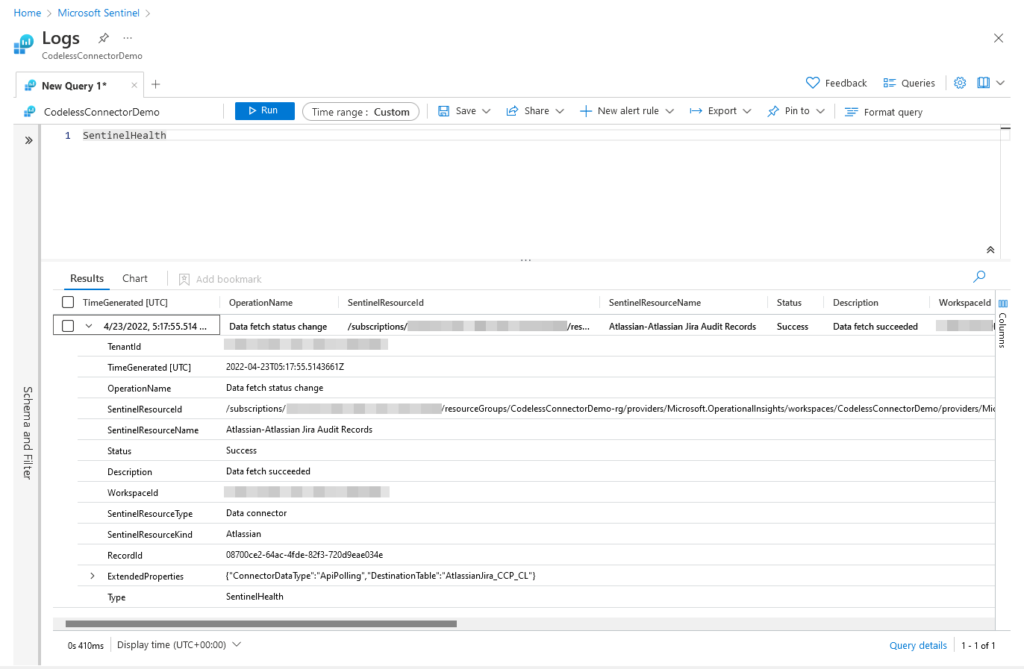
After a few minutes you should start to see data appear in the SentinelHealth table as your codeless connector successfully retrieves audit records from the Atlassian Jira REST API:
Conclusion
In this post we explored the process of using the new Codeless Connector Platform (Preview) to ingest Atlassian Jira audit logs into Microsoft Sentinel. Here’s a few additional examples to assist with creating your own connectors:
- Proofpoint TAP example - uses basic authentication and no pagination.
- GitHub Enterprise example - uses API key authentication with link header pagination.
- LastPass Enterprise example - uses API key authentication with a POST request payload and next page token pagination.